March 10, 2016 | Kathryn Tworkoski, PhD, Clinical Research Scientist | Regulatory Affairs, Medical Writing Services, Drug Development Consulting
Everyone knows that getting FDA approval of a new drug, whether it be a new molecular entity (NME) approved through a new drug application (NDA) or a new therapeutic biologic approved through a biologic license application (BLA), can be extremely challenging. But did you know that in 2014 and 2015, CDER approved record numbers of new drugs?
So what do I mean by “record numbers?” And are there any trends in the recent increases in approvals? Let’s take a more detailed look.
Peak Numbers of CDER‑Approved Drugs
The year 1996 is somewhat infamous (in certain crowds) as the year in which CDER approved the greatest number of new drugs; 53 in total.
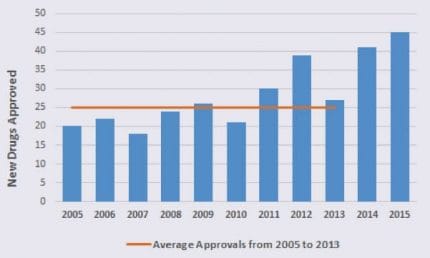 The year 2015 witnessed the second highest number of CDER‑approved new drugs (45 drugs) and the year before (2014) took third place with a respectable 41 new drug approvals.
To put those numbers in perspective, take a look at the graph to the left, which shows the number of new drugs approved annually. Between 2005 and 2013, CDER approved an average of 25 new drugs per year!
You should also know that between 2008 and 2012, the FDA approved 54.8% of drug applications in the first review cycle (note that this percentage represents both CDER and CBER approvals). In contrast, 78% and 87% of first cycle CDER drug applications were approved in 2014 and 2015, respectively.
So ultimately, more drugs are being approved at a faster rate than what we’ve seen in previous years. What’s driving this increase in new drug approvals?
As you might expect, there’s no single obvious answer. Instead, there are likely a number of contributing factors.
Increased New Drug Filings
First, and somewhat obviously, the number of NDAs/BLAs filed per year has increased slightly over the past decade.
Between 2005 and 2013, an average of 34 filings were made per year, compared with 41 filings in 2014 and 40 filings in 2015 (remember that an application may have been filed in one year and approved in another).
As you might expect, an increase in the number of new drug filings could potentially affect the number of approvals in a given year.
First in Class and Orphan Approvals
In recent years, there has also been a shift in the types of new drugs that are submitted to the FDA for approval:
- CDER had 17 first in class approvals (agents with a unique mechanism of action) in 2014 and 16 first in class approvals in 2015. Those are relatively high numbers; between 1987 and 2011, FDA first in class approvals were fairly steady and ranged from roughly 3 to 15 agents per year (note that these ranges are for NMEs only, not NMEs and biologics).
- CDER had 17 orphan approvals (for diseases affecting ≤200,000 Americans) in 2014 and 21 orphan approvals in 2015. Those are some of the highest numbers in recent years; as I mentioned in a recent blog post, the number of FDA orphan approvals has been steadily increasing since 2000.
So the unique and innovative qualities of the drugs submitted to the FDA in 2014 and 2015 may have contributed to the increase in CDER approvals.
FDA Expedited Programs
Additionally, the way in which the FDA works with industry on new drug development programs has been evolving. The FDA now offers 4 paths for expedited development and/or review, which can be used singly or in conjunction with each other: fast track, breakthrough therapy, priority review, and accelerated approval.
- In 2015, 14 of the 45 approved new drugs had fast track designation, 10 were designated as breakthrough therapies, 24 were given priority review, and 6 received accelerated approval. Similar numbers of expedited programs were used in 2014.
- The use of fast track, accelerated approval, and priority review programs has been steadily increasing since 1987.
- The breakthrough therapy designation was created in 2012, so it has only recently begun to take effect. But use of the designation is increasing: there were 21 approvals in 2015, 14 approvals in 2014, and 3 approvals in 2013.
In other words, expedited programs increase the speed at which new drugs are developed and reviewed, which could contribute to the number of CDER approvals in recent years.
Therapeutic Area
Between 1987 and 2014, oncology‑related therapeutics generated more fast track, accelerated, and priority approvals than any other therapeutic area. This fact is particularly interesting because in 2015, oncology was the single largest therapeutic area for which new drugs were approved:
- In 2015, 14 of the 45 approved new drugs (31%) were developed for the treatment of cancer; 1 additional drug was approved to treat chemotherapy‑induced nausea and vomiting.
- In 2015, the cancer subtypes most commonly treated by newly approved drugs were multiple myeloma (4 drugs) and lung cancer (3 drugs).
- In 2014, 8 of the 41 approved new drugs (20%) were developed for the treatment of cancer.
Perhaps the constant need for cancer therapeutics, coupled with their proven track record for obtaining accelerated approval (based on surrogate endpoints), may have contributed to their approval rate in recent years.
Looking Forward
Thus far, 2 new drugs have been approved in 2016 (Zepatier, for the treatment of Hepatitis C virus, and Briviact, for the treatment of epilepsy). Only time will tell whether the uptick in CDER drug approvals will continue in 2016 and whether the therapeutic type and expedited approval programs will affect FDA approval rates.
If you have any questions about NDA/BLA filings and approvals, don’t hesitate to contact us!